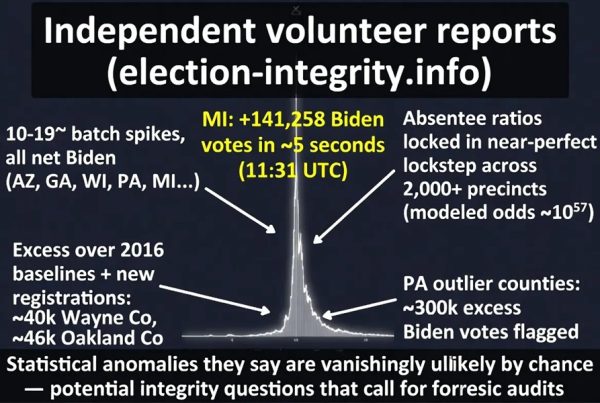
November 2020 election analysis makes a lot of sense now.
Note: back in 2020, your scribe was writing periodically for UNCOVERDC, among other blogs. One of the continuing features of UNCOVERDC these days is their daily “News from Around the Web,” which captures news items collected daily from various social media sources. Well worth taking a gander if you’ve never visited their website.
Immediately after the 2020 election, I was fortunate to be in contact with a group of independent analysts and experts in their respective fields, e.g., statistics, mathematics, computer science, etc., who provided early analysis of publicly available election data sets from Edison Research and other sources. Having remained in frequent contact with several of them to this very day (we regularly discuss election fraud news that breaks through the wall of legacy media obfuscation and lies), we have become good virtual friends – a commonplace occurrence these days.
With President Trump’s wonderful speech on 16 July that summarized five major election integrity issues (to say the least!) in our election systems, a re-posting of some of the election fraud-related articles written in 2020 and 2021 is in order. Time to connect some dots and for the election fraud-deniers to be held accountable! The deniers are part of a long-running conspiracy to disenfranchise legitimate American voters by pushing the false narrative that “the 2020 election was the most secure election in American history.” Nothing could be further from the truth.
The below article was posted on 12 November 2020 at UNCOVERDC here.
Pennsylvania Election Data Analysis: Some Very Suspect Counties
- by: Stu Cvrk
- 2020-11-12
Much has been written and commented on about voter fraud since Election Day, 3 November, from anecdotal evidence of poll watchers, to observations of concerned citizens, to various whistleblowers. Speculation has also been rampant about electronic ballot tampering, as well as the magical “discovery” of tens of thousands of ballots in key swing states like Michigan, Wisconsin, Georgia, and Pennsylvania. Facts are slowly leaking out, and President Trump’s team has filed lawsuits based on those facts in a number of states, as noted in this summary here. But what about statistical analysis of the votes counted?
At the request of the President’s team last weekend, a technical team was formed to conduct a statistical analysis of certain voter data in key states in order to determine whether there were any significant statistical anomalies evident, and if so, which counties were most suspect. The election objective of the team was to help ascertain that all legal votes — and only legal votes, be counted. The team consisted of five statistics experts who were sympathetic to that objective. Based on the datasets they are being provided, the team is looking for “where the bodies were buried” in terms of possible fraudulent behavior.
In one part of the team’s analysis of Pennsylvania, four counties were identified as being suspect: Montgomery, Chester, Cumberland, and Pike. Here is one graph that plotted Democrat-to-Republican registration ratio by Biden/Other Democrat votes.

The key to understand that graph is this: Biden’s vote totals in the four counties were 1.24 to 1.43 times greater than the totals for both Hillary Clinton and Barack Hussein Obama (both elections). This is an absurd result, especially in the three Republican-leaning counties, given that Republican support for President Trump has hovered at 95% over the past year-plus. What is the probability that more Pennsylvanians in these counties voted for a thoroughly compromised candidate who did not even campaign down the stretch than voted for either Barack Hussein Obama or Hillary Clinton?
Another graph plotted the Biden versus Trump ratio of votes by the number of extra votes Biden got.

Dots in the below the zero line reflect counties in which President Trump received more votes than Joe Biden. Blue dots indicate counties that have more registered Democrats than Republicans registered, and red dots vice versa. Chester, Delaware, Allegheny, Montgomery, and Philadelphia counties added the most “excess votes” to Biden. Chester is an outlier because it is predominantly Republican. These counties are ripe for an audited recount.
Another aberration in Montgomery county is that some 90%± of registered voters voted. That is an extraordinarily high – and suspicious – percentage. For comparison purposes, the Pennsylvania state average turnout in the 2016 national election was 61%.
The next graph plotted aggregate county vote totals over 92 equal increments of time, as officially reported on 3 November.

The Biden count curve starts about 18% below the Trump count curve and ends up being about 1% above it. It is striking that the two time-series curves that start so far apart end up so very close together; this is NOT a very likely outcome. There was a time period in the middle of the night where counting stopped for several hours (the “Pause”), and then resumed. At that point, it was known how many votes were needed by Biden to win. The jump in the blue curve is the filling in of those needed votes. This cannot be a coincidence. [Note: it takes time to count paper ballots, otherwise, the up-tick in the above graph for Biden would have been more vertical – and more starkly anomalous!]
There are two anomalies related to that time-series graph above. The first is that President Trump “lost” just under 10,000 votes at 21:15 on 4 November, but curiously from three different counties simultaneously: -1,063 Allegheny; -2,972 Bucks; -7,135 Chester. Biden never lost any votes at all over the several days of counting through 7 November. The second is that Biden received a big increase of 27,396 votes at 08:53 on 6 November over one consecutive reporting period. That bump equates to the “jump” in the blue line. Both of those anomalies account for Biden’s 34,000 vote lead in the datasets that were analyzed by the team.
The team also examined Biden votes versus the number of Democratic registered voters. Here is a sampling showing excess votes for Biden over the number of registered Democrats in these counties:

In all these counties, especially in Montgomery and Chester counties, there are more Biden votes counted than registered Democrats. It is not statistically reasonable for Biden to have received more Democratic votes, by 38,500± in Montgomery county and 36,600± in Chester country, than there are registered Democratic voters.
There were ten Pennsylvania counties in which Biden received excess votes above the Democrat totals in three prior presidential elections. Five counties alone had more Democrat excess votes added than the maximum number of votes added in the 2012 and 2016 elections. The team performed simple linear regressions to compare the number of registered Democrats who voted in those ten counties that delivered the most excess votes for Biden in 2020 versus the Democrat turnout in other Pennsylvania counties. They found that an average 70%± of registered Democratic voters voted in other than those ten counties while some 76% of registered Democrat voters supposedly voted in those ten counties that delivered the excess votes for the Biden “win.” That is an unexpected statistical aberration.
Lastly, a Benford’s law analysis was conducted on votes tabulated in heavily-Democrat Allegheny county. In simplified terms, the law asserts that the number 1 should appear more frequently as the lead digit in a precinct voter count. The number 2 should be less frequent, etc. The distribution, with no fraud, should decline exponentially. Here are the Benford graphs from the voter datasets analyzed for Allegheny county:

Note that the shape of the voter count first digits follows Benford’s Law rather closely for President Trump, but does not for Joe Biden. This anomalous result lends support for a complete audit of Allegheny county votes tabulated. [ ]
Keep in mind that this team — which is doing this all for free, and they all have busy lives otherwise — have only examined Pennsylvania and Milwaukee datasets so far. In both cases, they were given just a few hours to wade through pages of data, graph multiple possibilities, and then write a report. More exhaustive analyses are in process, and more datasets from other states will be forthcoming. The information summarized in this article is just a window in to the “anomalies” reported in many swing states over the past week, but it is becoming clearer that audits are required to achieve the team’s admirable objective of ascertaining that all legal votes — and only legal votes, be counted. This story is developing….
The end.
This is the first of several articles that detail analysis results that have been ignored for years. Imagine what might have been if the election fraud deniers who infest the legacy media had actually read this and subsequent reports.
Who still believes that 2020 was “the most secure election in American history”?
The end.
StuinSD is a reader-supported publication. To receive new posts and support his work, consider becoming a free or paid subscriber.
This article originally appeared in Stu Cvrk’s Substack. Reprinted here with permission
If you enjoyed this article, then please REPOST or SHARE with others; encourage them to follow AFNN. If you’d like to become a citizen contributor for AFNN, contact us at managingeditor@afnn.us Help keep us ad-free by donating here.
Substack: American Free News Network Substack
Truth Social: @AFNN_USA
Facebook: https://m.facebook.com/afnnusa
Telegram: https://t.me/joinchat/2_-GAzcXmIRjODNh
Twitter: https://twitter.com/AfnnUsa
GETTR: https://gettr.com/user/AFNN_USA
CloutHub: @AFNN_USA