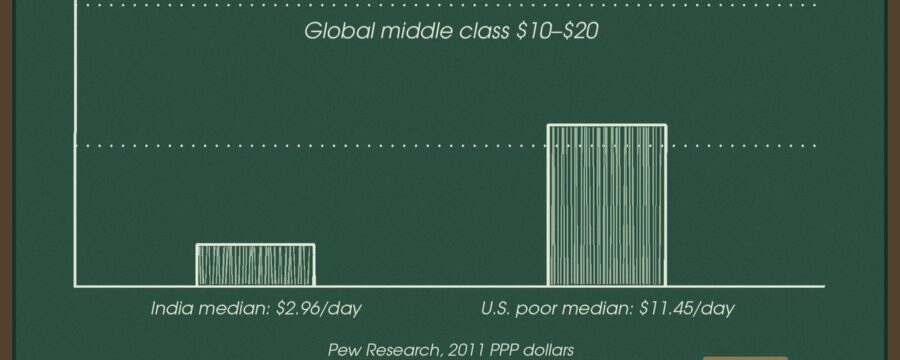
$11.45 a day.
That’s what Pew Research found the median American BELOW our poverty line had to live on, which put them in the global middle class while the median person in India had $2.96.
Not the median American. The median POOR American. Middle class, planet-wide.
I’m a science teacher. In my classroom a hypothesis isn’t a feeling. You state it, you test it, and you let the data try to kill it. So here’s mine, stated as rudely as possible so you finish reading: almost nobody in the United States is poor by the standard the rest of the planet lives by.
Prove me wrong. I’ll even help you. Before this is over I’m going to hand you the strongest evidence AGAINST me, because a teacher who only grades the answers he likes isn’t a teacher… He’s a congressman.
FIRST, DEFINE YOUR TERMS (THE PART WASHINGTON SKIPS)
“Poor” is the hardest-working word in Washington. It shows up to every press conference, every campaign ad, every budget fight. It never gets a day off. And it means about five different things depending on who’s holding the microphone.
It can mean:
- A household under a government income line.
- Someone who can’t afford the rent where they live right now.
- Someone who has less than the neighbors, even if they have plenty.
- Someone actually missing food, shelter, water, or power.
- Someone living below the global extreme-poverty line.
Those are not the same thing. Not even in the same neighborhood. When a politician says “34 million Americans live in poverty,” he wants you picturing the fourth bullet. He’s counting the first one.
So let’s look at the first one. The Census Bureau released “Poverty in the United States: 2025” on September 16, 2026. The official poverty rate was 10.2 percent. That’s 34.5 million people, and it’s the lowest rate on record. The official line for two adults and two kids was $32,649 a year.
Sit with that. $32,649 for a family of four, and that’s BEFORE counting SNAP, housing help, or the refundable tax credits, because the official measure counts pretax cash and ignores most noncash help entirely.
Now compare it to the World Bank’s international extreme-poverty line: $3.00 per person per day. For a family of four, that works out to $4,380 a year in 2021 international dollars. Adjust for four years of inflation and you’re still somewhere around five grand.
Our poverty line is roughly six times the line the global poverty debate is really about. Same word. Different planet.
EXHIBIT A: THE POOR AMERICAN, GLOBAL MIDDLE CLASS
Pew Research Center, July 2015. Researchers lined up daily per-person income across the world in purchasing-power dollars at 2011 prices. That’s the adjustment that accounts for a sandwich costing different amounts in different countries. They set the global middle-income band at $10.01 to $20 a day.
The median American below the poverty line: $11.45.
More than half of the people our government officially labels “poor” cleared the world’s middle-class bar. Pew put 56 percent of ALL Americans in the global high-income group, above $50 a day. Another 32 percent were upper-middle.
India’s national median in the same project: $2.96 a day. Not India’s poor. India’s MIDDLE. The poor American had roughly 3.9 times what the typical person in India had.
Now, those are 2011 numbers published in 2015, and India has grown a lot since. I’m not passing that ratio off as a 2026 snapshot. That’s how people get caught fudging, and I grade too many papers to fudge my own. Doesn’t matter. Put the asterisk on it and the point still stands… our “poor” and the world’s middle class overlap. A lot.
EXHIBIT B: “BUT THINGS ARE CHEAPER OVER THERE”
Every time I post something like this, somebody shows up with the same objection, delivered with the confidence of a man who invented economics on his lunch break. “Rice is cheaper in India, Mike!”
Yes. Researchers know. That’s what purchasing power parity IS. PPP adjusts for local prices, so a dollar’s worth of groceries in Ohio and a dollar’s worth in Uttar Pradesh buy comparable baskets. Pew used it. The World Bank uses it. Nobody in the room forgot that prices are different in different places. You didn’t catch the economists in a gotcha. You caught them doing their homework.
Is PPP perfect? No. A renter in San Francisco and a retiree in rural Arkansas live on very different budgets, and one national number can’t see either of them clearly. I’ll come back to that, because it’s the best card you have against me. But “things cost different amounts” was already in the math before you showed up.
EXHIBIT C: THE WORLD BANK’S 1 PERCENT, AND WHY EVEN THAT’S TOO HIGH
In June 2025 the World Bank reset its extreme-poverty line to $3.00 per person per day. World Bank data put the share of Americans below that line at about 1 percent in 2024.
“Aha,” you say. “There they are. Three million Americans living like the world’s poorest.”
Not so fast. That number comes from what people TELL a survey they earned. And survey income in this country is, to use the technical term, a mess. People underreport. A self-employed contractor has a bad year and reports a loss. SNAP and housing aid don’t show up as cash at all.
Economist Bruce Meyer and his coauthors, including researchers at the Census Bureau, actually checked. They took households that told the Census Bureau’s SIPP survey they were living on less than $2 a person per day, then linked them to administrative records: tax filings, benefit records, assets. After correcting for reporting errors, in-kind benefits, and substantial assets, fewer than 10 percent of those households were still in extreme poverty. Many of the largest misclassified groups looked at least middle class.
Fewer than one in ten, of a group that was already about 1 percent. The people left are real, and I’ll get to them. But the “millions of Americans live like the poorest villages on Earth” headline didn’t survive contact with the paperwork. Slight oversight!
EXHIBIT D: THE STUFF THAT ISN’T ON YOUR PAY STUB
Income numbers can’t see the lights.
The 2025 Tracking SDG 7 report estimated that 666 million people on Earth had no access to electricity in 2023. WHO and UNICEF reported that in 2024, 2.1 billion people lacked safely managed drinking water and 3.4 billion lacked safely managed sanitation. Billion. With a B. That’s roughly four out of every ten human beings alive.
Then there’s cooling. In 2018 the International Energy Agency reported that only about 8 percent of the 2.8 billion people living in the hottest parts of the world had air conditioning. The U.S. Energy Information Administration’s 2020 household survey found that 88 percent of American households use air conditioning.
Let me put that in classroom terms. A poor American in July turns a knob. A lot of middle-class families in the hottest places on Earth open a window and pray for wind.
None of that shows up on a W-2. You can’t put a power grid on a pay stub. But if you want to know who’s poor, “can you keep milk cold and the lights on” is a pretty good question, and in the United States the answer is overwhelmingly yes.
A QUICK INTERMISSION FROM A CLEVELAND AMBULANCE
I spent about twenty years as a paramedic in Cleveland before I ever wrote a lesson plan. I’ve been inside more low-income homes than most members of Congress have driven past with the windows up.
So understand that I’m not writing this from a country club. I’ve seen real hardship up close. I’ve also watched what politicians call “poverty” on cable news, and I’ve noticed the two rarely match. One of them needs help. The other one needs a camera crew and a sad piano track.
EXHIBIT E: THE SAFETY NET THEY PRETEND ISN’T THERE
Pop quiz. When the Census Bureau calculates the official poverty rate, does it count SNAP?
No.
Housing assistance? No. School lunches? No. The refundable part of the tax credits? Also no. The official measure compares pretax cash income to a threshold. Social Security counts because it’s cash. Most of the rest of the safety net is invisible to it. A poverty measure that can’t see a SNAP card is a smoke detector with no battery. It’s up on the ceiling. It just doesn’t tell you anything.
Imagine grading a student’s test but refusing to turn the page over. Then announcing to the whole school that the kid failed. That’s what happens when politicians use the official rate to describe how people live.
The Census Bureau knows this, which is why it also publishes the Supplemental Poverty Measure. The SPM adds noncash benefits and tax credits, then subtracts taxes, work expenses, and out-of-pocket medical costs, and adjusts for local housing prices. For 2025, the SPM came in at 13.1 percent. That’s HIGHER than the official rate, because it subtracts expenses too. I’m not hiding that. But notice what neither number measures: whether you have running water, electricity, a refrigerator, or dinner. They measure dollars against a line. A line drawn by Americans, at American prices, to an American standard.
Which brings me to my new bill. I call it the Permanent Poverty Preservation Act. Every time the poverty rate falls, Congress simply raises the line until enough Americans are back under it to film another campaign ad. That way no politician ever runs out of people to rescue. This is not a radical idea. It’s just common sense.
To be fair, the official line only moves with inflation. The RHETORICAL line moves with the election calendar. Some of these folks couldn’t find the poverty line with a flashlight and a Census map, but they can find a microphone in the dark.
EXHIBIT F: THE SAFETY NET WASHINGTON DIDN’T BUILD
Every poverty number I’ve shown you so far has the same blind spot. It counts what the government hands out. It doesn’t count the church on the corner.
Great question, where do hungry people in my town go on a Tuesday night? Let me look it up. Looking… Looking… Oh. It’s the Methodists. And the Catholics. And a Baptist church with a parking lot full of pickup trucks and a basement full of canned corn.
That’s not just my town. The National Congregations Study found that in 2018, nearly half of America’s congregations, 48 percent, either ran their own food program or helped support one. Nobody filed a federal grant application. Somebody’s grandmother showed up with a crockpot and a sign-up sheet.
Follow the money. Giving USA reports that Americans gave $617.2 billion to charity in 2025, the first time in the report’s 71 years it topped $600 billion. More than $151 billion of that went to religion, about 23 percent of everything given. That’s the offering plate. It pays for things like the food pantry, the rent check for the widow down the street, the gas card for the guy between jobs, and the Thanksgiving boxes stacked in the fellowship hall.
Now guess how much of that shows up in the official poverty rate.
Zero. Not one can of green beans. A church can feed a family every week for a year and the Census Bureau’s number won’t move a decimal, because the official measure only counts cash income. The Supplemental measure picks up government benefits like SNAP. A bag of groceries from First Baptist doesn’t count in either one.
And none of this is new. Paul gave Timothy an order of operations for taking care of people, and it’s all in one chapter. 1 Timothy 5 starts with the family: “But if anyone does not provide for his own, and especially for those of his household,” Paul says he has denied the faith and is worse than an unbeliever (1 Timothy 5:8, LSB). Then the church steps in for the ones with nobody, “those who are widows indeed,” and believers with widows in their own family are told to “assist them and the church must not be burdened” (1 Timothy 5:16, LSB).
Family first. Then the church, for the people who have no one. Rome had a grain dole. Paul never told Timothy to sign anybody up for it.
EXHIBIT G: THE SAFETY NET THEY TORE DOWN
Here’s the one nobody in Washington wants to touch with a ten-foot pole. The oldest anti-poverty program in human history is a married mom and dad under the same roof.
Census Bureau, 2024. Married-couple families had a poverty rate of 4.3 percent. Families headed by a single father: 11 percent. Families headed by a single mother: 21.8 percent. That’s five times the married rate.
Five times. If a drug cut your odds of poverty by 80 percent, every senator in America would be holding a press conference demanding it be free. It IS free. They just don’t like the side effects… which apparently include fathers.
It gets better. In 2017, Wendy Wang and Brad Wilcox looked at millennials using federal survey data. The ones who finished high school, worked full time, and got married BEFORE having kids? By their late twenties and early thirties, 97 percent were not poor. Researchers call it the success sequence. Three steps. No federal agency. No app. No five-year plan.
Sociologists will argue about how much of that gap is marriage itself and how much is the kind of people who get married. Fine. Argue. Nobody argues the gap isn’t there.
So where did the families go? In 1960, about 5 percent of American babies were born to unmarried mothers. In 2024, CDC’s final birth data put it at 39.5 percent. Lots of things happened in between, and I’m not going to pretend it was only one. But one of them was a welfare system that, for decades, was built around the missing father.
AFDC, the main cash welfare program, was set up mostly for homes WITHOUT a dad. Some states enforced “man in the house” rules that cut a mother off if a man was found living there, until the Supreme Court struck those rules down in King v. Smith in 1968. And because benefits shrink as household income rises, a working husband’s paycheck can still cost a family its help today. Analysts on the left and the right both call that a marriage penalty. Democrats built that system in the New Deal and expanded it in the Great Society. When Republicans finally forced welfare reform in 1996, a Democratic president signed it only after vetoing it twice.
Quinn’s First Law of Liberalism: liberalism always generates the exact opposite of its stated intent. Build a program to help kids without fathers, pay by the missing father, and act shocked, SHOCKED, when you get more missing fathers. Set your watch by it.
In 1965, a Democrat in Lyndon Johnson’s own Labor Department, Daniel Patrick Moynihan, wrote a report warning that the breakdown of the family would trap people in poverty for generations. He got called a racist for his trouble. He went on to serve four terms as a Democratic senator from New York. His party listened to him on almost everything except the one thing he got most right.
Before somebody clips this out of context: I’m not aiming at single moms. A lot of single moms are the toughest people in America, and I met plenty of them on Cleveland ambulance calls holding a whole household together alone. I’m aiming at the people who made Dad optional, sent the bill to the taxpayer, and called it compassion.
Four kids. A teacher’s paycheck. Ohio. I know what groceries cost. I also know the cheapest way to raise a kid out of poverty is two parents, a job, and a church that shows up when the job falls through. We still have the church. If the Left hadn’t spent sixty years taking apart the family… we’d have that too.
SO WHY DOES IT FEEL SO BAD?
Because most American poverty is relative, and relative poverty still hurts. Your phone shows you, every hour, somebody with a bigger house, a better vacation, a newer truck. Nobody’s feed is full of a family in rural Malawi hauling water. You compare yourself to the neighbor, not the planet.
And rent is real. Medical bills are real. Child care can eat a paycheck alive. A family can have electricity, water, and a refrigerator and still lie awake doing math at 2 a.m. I’m not going to pretend that isn’t stress. It is.
But politicians have built whole careers on telling you that you’re drowning, so you’ll hand your vote to the guy holding a life preserver he bought with your own tax money. If you never feel poor, you never need him. Keep that in mind the next time a senator worth eight figures tells you how hard you have it. All hat and no cattle, that one, and the hat was paid for by you.
OKAY. HERE’S HOW YOU PROVE ME WRONG.
I promised you the best evidence against my own headline. Here it is, and I’m not going to wiggle out of it.
- HUD’s January 2025 point-in-time count found 745,652 people homeless on a single night. 266,320 of them were unsheltered: streets, cars, tents, under bridges. That’s one night. More people cycle through over a full year.
- A study published in Nature Cities in December 2024 estimated that about 1.1 million Americans, in more than half a million households, lived in homes without running water in 2021. In the United States. Most people assume that number is zero. It isn’t.
- USDA reported that 13.5 percent of households were food insecure at some point in 2023. That is not starvation. It means trouble affording enough food at times during the year. Still not nothing.
- CDC recorded 20,552 deaths with malnutrition as the underlying cause in 2022. Before anybody runs off with that, about 93 percent were 65 or older, and dementia, cancer, and swallowing problems drive a lot of it, so it doesn’t isolate “couldn’t afford groceries.” But an old man who can’t get to the store and has nobody checking on him is a failure no matter what you call it.
There it is. If you came to prove me wrong, those four bullets are your ammunition. The literal headline, “no one in America is poor,” doesn’t survive them. I knew that when I typed it. I wrote a hypothesis designed to be tested, and it got tested. That’s called science. Cable news should try it sometime.
But look at who’s in those bullets. It isn’t the 34.5 million. It’s a much smaller group, and they’re not poor in the “my paycheck is under a line” sense. They’re in real deprivation, and an awful lot of them are dealing with addiction, mental illness, old age, disability, or plain isolation. A bigger SNAP card doesn’t help a man with dementia who can’t remember to eat. A housing voucher doesn’t help a guy who won’t come inside. Those are medical and human problems wearing a poverty costume.
And look closer at who shows up in those bullets most. The old man nobody checks on. The guy under the bridge nobody’s out looking for. What’s the common thread? Usually it isn’t a missing government program. It’s a missing person. No spouse. No kids calling. No pastor who knows his name.
FINAL GRADE
Here’s my graded answer, red pen and all.
By the standard the rest of the world uses, almost no one in America is poor. The median officially poor American cleared the global middle-class line. Our extreme-poverty rate by survey income is around 1 percent, and when economists checked the records, most of that evaporated. We have electricity, clean water, and air conditioning at rates billions of people would call luxury.
By the American standard, yes, 34.5 million people sit under a line we drew, and plenty of them are genuinely stretched by rent, medical bills, and child care. That’s real. It’s also a different question.
And at the very bottom, there’s a smaller group living in real deprivation: the homeless, the isolated elderly, the families with no water coming out of the tap. They deserve better than being used as the mascot for a spending bill whose money mostly goes somewhere else.
The best anti-poverty programs in this country don’t have a federal budget line. One meets on Sunday morning. The other one sits at your kitchen table. Washington can’t count either of them, so Washington acts like they don’t exist.
The problem isn’t that America ignores poverty. The problem is that Washington uses one word for three different problems, so it never fixes any of them, and it keeps paying to replace the two institutions that used to fix most of them for free. You can’t treat a broken leg, a cold, and heartburn with the same pill and call it medicine. I was a medic. I checked.
Two sentences. Both true. America is the richest place poor people have ever lived. And there are still Americans who need help we aren’t giving them. If your politician can only say one of those two sentences, he isn’t informing you. He’s selling you something, and you’re the one paying for it.
I’ve been down this road before. If you want to see what I think should replace SNAP, start here:
And if you think Congress can fix housing with a 381-page bill, I read it so you don’t have to:
 Mike Borowski is a medically retired Army combat medic with 23 years of service, including a combat deployment to Iraq, and a high school Anatomy and Physics teacher at a high-need Career Technical district in Northeast Ohio — where he also wrote and published the textbooks for both courses. He runs “Bski’s Classroom,” a platform dedicated to cutting through political noise with data, history, and the kind of blunt honesty that comes from someone who has seen both war and the American classroom up close.
—
X (Twitter): x.com/BskiMike22802
Substack: substack.com/@bskimike22802
YouTube: www.youtube.com/@BskiMike22802
AFNN: https://afnn.us/author/mikeborowski/
If you enjoyed this article, then please REPOST or SHARE with others; encourage them to follow AFNN. If you’d like to become a citizen contributor for AFNN, contact us at managingeditor@afnn.us Help keep us ad-free by donating here.
Substack: American Free News Network Substack
Truth Social: @AFNN_USA
Facebook: https://m.facebook.com/afnnusa
Telegram: https://t.me/joinchat/2_-GAzcXmIRjODNh
Twitter: https://twitter.com/AfnnUsa
GETTR: https://gettr.com/user/AFNN_USA
CloutHub: @AFNN_USA